A Comprehensive Analysis of How WCAG Compliance Drives Revenue, Mitigates Risk, and Optimizes Operational Efficiency
In the contemporary digital economy, the perception of Web Content Accessibility Guidelines (WCAG) compliance has undergone a radical transformation. No longer viewed merely as a regulatory checkbox or a pillar of Corporate Social Responsibility (CSR), digital accessibility has emerged as a primary driver of financial performance, market competitiveness, and operational resilience. The convergence of an aging global population, the aggressive enforcement of civil rights legislation, and the dawn of Artificial Intelligence (AI) has created a business environment where the cost of exclusion significantly outweighs the investment of inclusion.
This report provides an exhaustive, data-driven analysis of the financial imperative for digital accessibility. Synthesizing data from 2023 through 2025, it demonstrates that organizations prioritizing accessibility achieve tangible returns on investment (ROI) through three distinct mechanisms: the capture of the “Purple Pound” (a market segment valued in the trillions), the reduction of legal and remediation costs through “Shift Left” engineering, and the optimization of digital assets for the emerging field of Generative Engine Optimization (GEO).
Evidence from multinational corporations such as Tesco, Barclays, and Legal & General, alongside public sector data from the U.S. Department of Justice and the UK Government Digital Service, illustrates a clear pattern: accessible digital infrastructure is inherently higher-performing, more robust, and more profitable. As the digital ecosystem shifts toward AI-mediated interactions, the semantic rigour required by WCAG compliance is becoming the foundational requirement for visibility in the age of generative search. This document serves as a strategic roadmap for stakeholders to leverage compliance not just for risk mitigation, but as a catalyst for sustainable growth.
1. The Macroeconomic Imperative: The “Purple Pound” and the Cost of Exclusion
The most immediate and compelling argument for investment in digital accessibility is the sheer scale of the addressable market it unlocks. For decades, businesses have inadvertently alienated a massive consumer demographic—people with disabilities—under the false assumption that this group represents a niche or statistically insignificant portion of the customer base. Current data unequivocally refutes this, revealing that the disability market acts as a massive, dormant economic force.
1.1 The Global Economic Power of the Disability Market
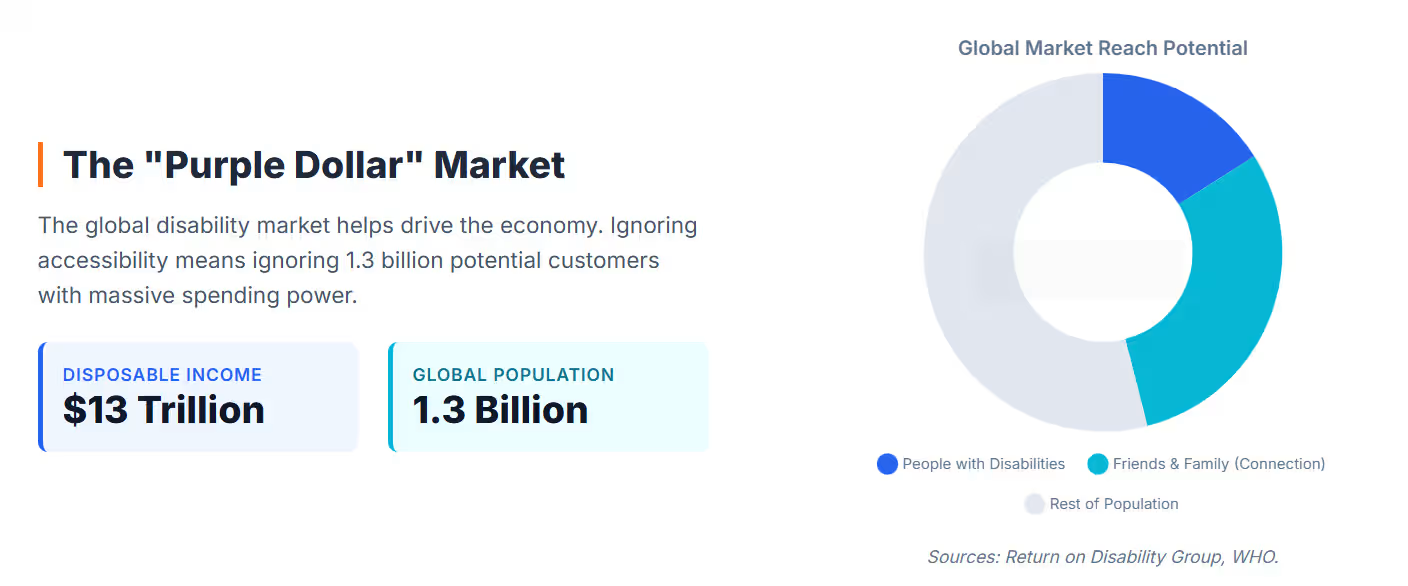
The global population of persons with disabilities has reached approximately 1.3 billion people, representing roughly 16% of the world’s population.1 This figure is not static; it is expanding due to the aging of the “Baby Boomer” generation, a demographic cohort that controls a disproportionate amount of household wealth and is increasingly acquiring age-related impairments such as declining vision, hearing loss, and motor control issues.
The economic aggregate of this demographic is referred to as the “Purple Pound” in the United Kingdom, where the collective spending power of disabled households is estimated at £274 billion per year.2 On a global scale, the figures are even more staggering. The disposable income of the disability market is estimated between $8 trillion and $13 trillion annually.3 To contextualize this, if the disability community were a standalone nation, its economy would rival that of the United States or China.
Furthermore, the economic impact of accessibility extends beyond the individual with the disability. The “network effect” implies that family members, friends, and caregivers often dictate their consumption habits based on the inclusivity of the environments they navigate with their loved ones. When accounting for this broader circle, the consumer base impacted by accessibility decisions expands to cover nearly 53% of the population.4 Consequently, a business that fails to accommodate a disabled user does not just lose that single transaction; it risks alienating the entire social network connected to that individual.
1.2 The “Click-Away Pound”: Quantifying Lost Revenue
Despite the magnitude of this market, a profound disconnect remains between consumer purchasing power and digital business readiness. Research indicates that only 10% of businesses have a defined strategy to access this market, creating a massive efficiency gap in the digital economy.3 This gap manifests as the “Click-Away Pound”—revenue lost when disabled users abandon inaccessible websites in favor of competitors who offer a usable experience.
In the United Kingdom, the Click-Away Pound report estimated that retailers lost £17.1 billion in 2019 alone due to inaccessible website design.2 In the United States, pure-play e-commerce retailers are estimated to lose over $6.9 billion annually specifically due to non-compliance with accessibility standards.7 These figures are likely conservative estimates, as they predate the massive acceleration of digital adoption driven by the post-2020 economic landscape.
The mechanism of this loss is swift and decisive. Data suggests that 71% of users with disabilities will abandon a website immediately if they encounter significant accessibility barriers.8 Unlike a physical store, where leaving requires effort, the digital “exit” is a single click. Conversely, the loyalty dividend for accessible brands is substantial: 82% of customers with access needs state they would spend more and remain loyal to a brand with an accessible website.9 In an era where customer acquisition costs (CAC) are rising, the retention power of accessibility represents a significant efficiency gain.
1.3 Brand Reputation and the ESG Multiplier
Beyond direct revenue metrics, accessibility has become a critical component of brand equity and Environmental, Social, and Governance (ESG) performance. Modern consumers are increasingly values-driven, scrutinizing the ethical behaviors of the corporations they patronize. Nielsen reports that 66% of consumers are willing to pay a premium for products from companies committed to positive social impact.10
In this context, digital accessibility serves as a verifiable metric of social inclusion. It transforms diversity from a marketing slogan into a measurable operational reality. Companies like Sainsbury’s and Microsoft have leveraged their commitment to accessibility to enhance their corporate reputation, positioning themselves as leaders in ethical innovation. For Sainsbury’s, this has involved creating an “inclusive culture” that reflects the diversity of its customer base, thereby strengthening brand affinity among the general public, not just those with disabilities.11
Table 1: The Economic Dimensions of Digital Accessibility
| Economic Factor | Statistic | Source | Implications |
| UK Purple Pound | £274 Billion | 2 | Massive domestic market often ignored by UK retailers. |
| Global Disposable Income | $8 – $13 Trillion | 3 | Represents a market size comparable to the world’s largest economies. |
| Click-Away Loss (UK) | £17.1 Billion | 2 | Direct revenue leakage to competitors with better UX. |
| Click-Away Loss (US) | $6.9 Billion | 7 | Specific loss for the e-commerce sector due to non-compliance. |
| Customer Abandonment | 71% | 8 | Immediate bounce rate increase for inaccessible sites. |
| Loyalty Premium | 82% | 9 | High retention potential for brands that get accessibility right. |
2. The Legal Landscape 2024-2025: Risk Mitigation as a Financial Strategy
While the “carrot” of revenue growth is compelling, the “stick” of legal liability has become the primary driver for immediate executive action. The litigation landscape regarding digital accessibility has evolved from sporadic filings into a systemic risk category for businesses of all sizes. The costs associated with non-compliance—ranging from legal defense fees to settlements and mandated retrofitting—have made accessibility a crucial element of corporate risk management.
2.1 The Explosion of ADA Title III Litigation
The trajectory of lawsuits filed under Title III of the Americans with Disabilities Act (ADA) shows a relentless upward trend. In 2024, the legal environment became increasingly hostile for non-compliant entities. Over 4,000 lawsuits were filed in federal and state courts regarding web accessibility in 2024 alone.12 By the end of the year, total ADA Title III complaints reached approximately 8,800, marking a 7% increase from the previous year.14
This surge is characterized by distinct shifts in plaintiff strategy:
- Venue Shopping: While federal filings remain high, there is a strategic shift toward state courts, particularly in New York and California. These jurisdictions have state-level civil rights laws (such as California’s Unruh Civil Rights Act) that allow for compensatory damages, which are not available under the federal ADA.12
- Targeting of Repeat Offenders: Settlement does not equal immunity. In 2024, 41% of federal filings were against companies that had already been sued previously.12 This indicates that many businesses are settling lawsuits financially but failing to remediate the underlying technical issues, leaving them vulnerable to subsequent claims.
- Democratization of Targets: The notion that only large corporations are targets is obsolete. In 2023 and 2024, nearly 70% of accessibility lawsuits targeted small to medium-sized businesses (SMBs).15 The lower barrier to entry for filing lawsuits, aided by automated scanning tools used by plaintiff firms, means no revenue tier is safe.
2.2 The High Cost of Defense and Settlement
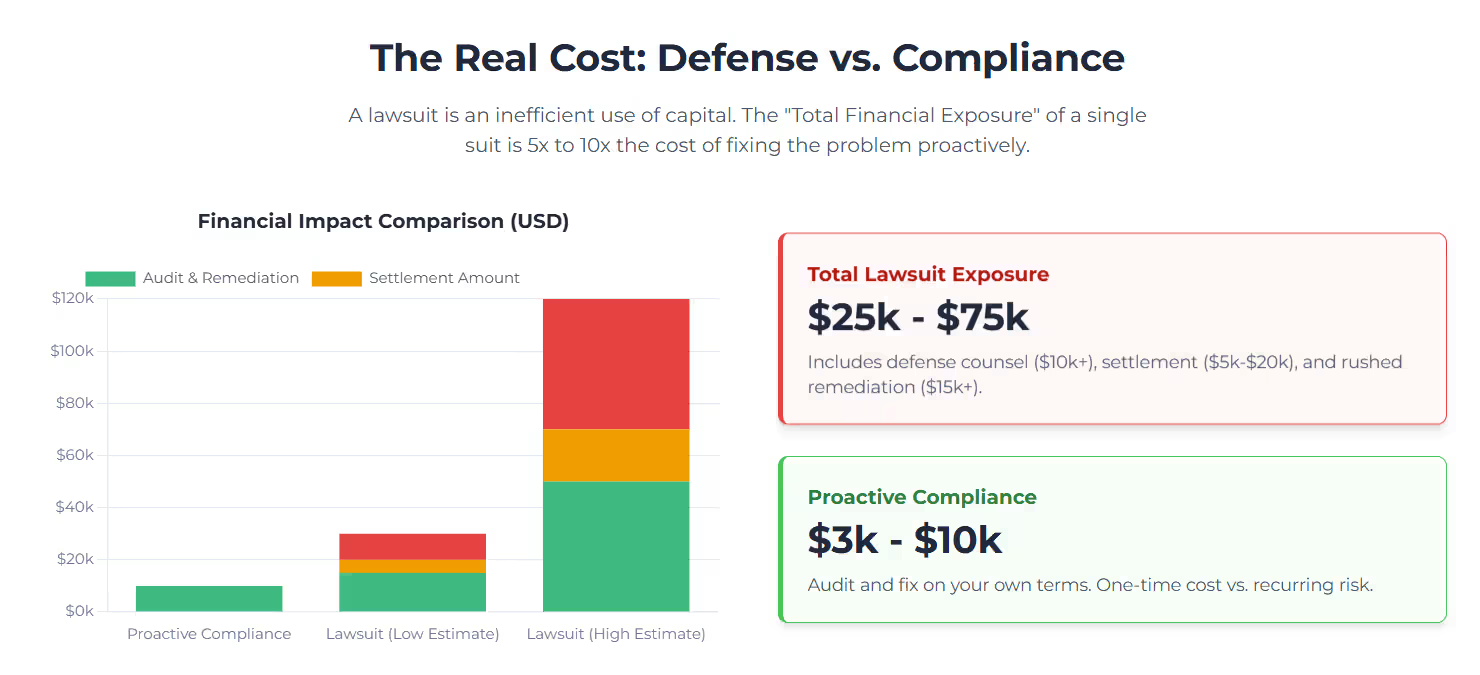
The financial impact of a lawsuit extends well beyond the settlement figure. A comprehensive cost analysis reveals that litigation is an inefficient use of capital compared to proactive compliance.
- Legal Defense Fees: Even if a business decides to settle quickly, engaging counsel to negotiate the terms typically costs between $10,000 and $50,000+ per case.16 If a case goes to trial, these costs can escalate exponentially.
- Settlement Amounts: Most ADA website cases settle for amounts ranging between $5,000 and $20,000.17 However, this is merely the payment to the plaintiff.
- Mandated Remediation: Virtually all settlements include a consent decree requiring the business to make their website WCAG compliant within a specific, often aggressive, timeframe. Remediation under duress is expensive. It often requires hiring external consultants at rush rates, costing between $15,000 and $50,000.19
Total Financial Exposure: A conservative estimate for a single ADA lawsuit typically results in a total cash outflow of $25,000 to $75,000.19 In stark contrast, a proactive audit and remediation for a small to medium website might cost $3,000 to $10,000.21 Thus, the cost of defense is often 5x to 10x the cost of proactive compliance.
2.3 The Failure of “Quick Fix” Overlays
A critical development in the 2023-2025 period is the definitive failure of accessibility “overlays” or widgets—automated tools that insert a line of JavaScript to “fix” a site’s accessibility. Marketing for these products often claims instant compliance, but the legal reality is starkly different.
Data from 2024 reveals that 22.6% of all digital accessibility lawsuits targeted websites that had these accessibility widgets installed.22 Courts and regulators have increasingly scrutinized these tools. The Federal Trade Commission (FTC) has taken action against overlay providers for false advertising, noting that these tools often fail to address fundamental code-level barriers such as keyboard navigation traps or missing screen reader labels.13 For businesses, relying on an overlay is not a risk mitigation strategy; it is a liability multiplier that signals to plaintiff attorneys that the underlying site is likely non-compliant.
2.4 The European Accessibility Act (EAA) 2025
For organizations with a global footprint, the regulatory landscape is about to become significantly more stringent. The European Accessibility Act (EAA), which comes into full force in June 2025, represents a paradigm shift from the U.S. litigation-driven model to an EU regulatory enforcement model.
The EAA mandates accessibility for a wide array of products and services, including e-commerce services, banking services, computers, and operating systems. Unlike the ADA, which relies on civil lawsuits, the EAA is enforced by member state authorities with the power to issue administrative fines.
- Fines and Penalties: Penalties for non-compliance can range from €5,000 to €20,000 per violation, with provisions for daily fines for ongoing non-compliance.24
- Severe Sanctions: In specific jurisdictions like France, fines can reach €250,000, and in Ireland, severe non-compliance can theoretically lead to imprisonment for up to 18 months.24
- Market Exclusion: Perhaps most damaging is the potential for non-compliant products or services to be suspended or removed from the EU market entirely.26
This regulatory shift forces multinational companies to adopt WCAG 2.1 AA (or higher) as their global baseline, effectively harmonizing standards upward to meet the strictest requirement.
Table 2: Comparative Risk Profile (ADA vs. EAA)
| Feature | Americans with Disabilities Act (ADA) | European Accessibility Act (EAA) |
| Enforcement Mechanism | Civil Litigation (Private Lawsuits) | Regulatory Enforcement (Government Authorities) |
| Primary Financial Risk | Legal Fees + Settlements ($25k – $75k avg) | Administrative Fines (€5k – €250k) |
| Operational Risk | Court Orders / Consent Decrees | Market Suspension / Daily Penalties |
| Key Trend (2024-25) | Shift to State Courts; Anti-Overlay Rulings | Implementation Deadline (June 2025) |
| Global Impact | High for US-facing entities | High for any global commerce entity |
3. Operational Efficiency: The Economics of “Shift Left”
While revenue and risk are external factors, digital accessibility also drives significant internal operational efficiencies. The engineering principles required to achieve WCAG compliance—such as semantic HTML, separation of structure and presentation, and rigorous testing—are synonymous with high-quality software development.
3.1 The “Shift Left” Strategy: Reducing Development Costs
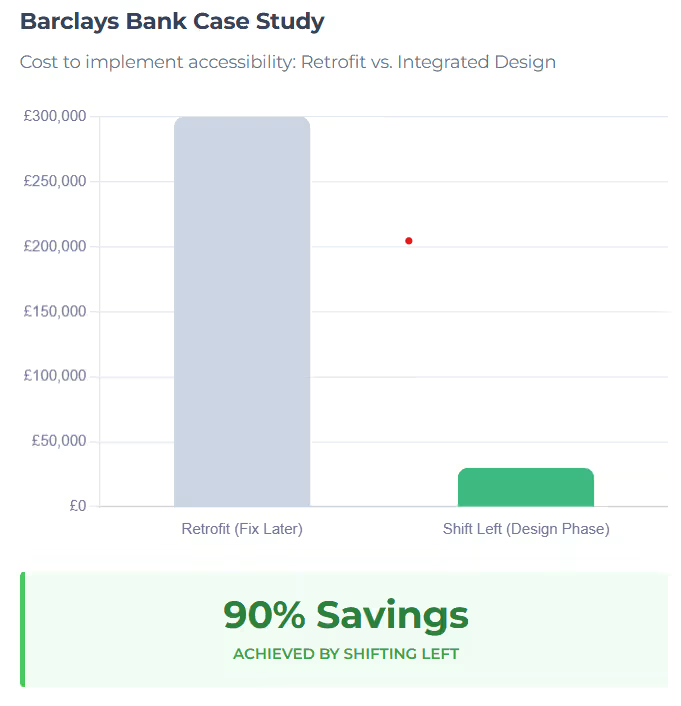
In software engineering economics, the cost of fixing a defect increases exponentially the later it is detected in the development lifecycle. This is known as the “cost of change curve.” Accessibility defects follow this same trajectory. Addressing accessibility during the design phase is exponentially cheaper than retrofitting a live product.A seminal case study from Barclays Bank illustrates this principle with financial precision. When Barclays initially assessed the cost to retrofit accessibility fixes into their existing mobile banking app, the estimate was £300,000. Recognizing this inefficiency, the bank adopted a “Shift Left” approach for the next iteration, integrating accessibility requirements into the initial wireframes and design mockups. The total cost for the accessible build using this integrated approach was only £30,000—a 90% reduction in development costs.27
This demonstrates that accessibility is not inherently expensive; remediation is expensive. By treating accessibility as a non-functional requirement equal to security or performance, organizations can avoid the “accessibility debt” that plagues legacy systems.
3.2 The “Curb-Cut Effect” in Digital UX
The “Curb-Cut Effect” is a phenomenon where features designed for people with disabilities end up benefiting the general population. In the physical world, sidewalk ramps designed for wheelchairs are used by parents with strollers, travelers with luggage, and delivery workers.
In the digital realm, this effect translates to improved User Experience (UX) metrics for all users:
- High Contrast: While essential for users with low vision, high-contrast interfaces are critical for mobile users viewing screens in bright sunlight.
- Captions: Designed for the deaf and hard of hearing, captions are now consumed by 80% of social media users who watch videos on mute in public spaces.28
- Keyboard Navigation: Essential for users with motor impairments, keyboard shortcuts are preferred by power users and developers for speed and efficiency.
The financial implication of the Curb-Cut Effect is improved customer retention and reduced bounce rates. A faster, cleaner, more navigable site (a byproduct of accessibility) retains more users. For example, Tesco’s accessible website was found to load significantly faster than their standard site, attracting a large cohort of non-disabled users with slower internet connections or older hardware, which directly contributed to their revenue growth.29
3.3 Reducing Customer Support Costs
Inaccessible digital channels force users to revert to expensive analog channels. When a disabled user cannot complete a transaction on a website, they do not simply disappear; they call the customer support line.
A digital transaction typically costs pennies, whereas a live agent support call costs between $5 and $12. For government agencies and large service providers, this differential is massive. The U.S. Department of Justice (DOJ) estimates that the implementation of digital accessibility standards for state and local governments will result in time savings and operational efficiencies worth $192.6 million per year.30 This saving is primarily driven by shifting residents from in-person visits and phone calls to digital self-service.
Similarly, the UK Government Digital Service (GDS) reported that by simplifying their interface and reducing the number of inaccessible PDFs from 12,000 to a few hundred, they not only improved accessibility but also reduced the average time users spent on pages, indicating faster successful task completion.29
Download Barclays Bank Case Study
4. The Revenue Engine: SEO and Generative Engine Optimization (GEO)
Perhaps the most forward-looking argument for accessibility is its symbiosis with search discoverability. As the internet transitions from traditional search engines to AI-driven answer engines, the technical standards of WCAG are becoming the prerequisites for visibility.
4.1 Accessibility as the Foundation of Modern SEO
Google’s ranking algorithms are designed to mimic human user behavior, but technically, a search engine crawler operates much like a screen reader used by a blind person. Both rely on the underlying code structure to interpret the content of a page.
- Semantic Structure: WCAG requires the use of proper heading tags (H1, H2, H3) to define the hierarchy of information. This helps screen readers navigate, but it also signals to Google the relative importance of content topics, improving indexing accuracy.29
- Descriptive Links: Using “Click here” is bad for accessibility (it gives no context to a screen reader) and bad for SEO (it wastes a keyword opportunity). WCAG requires descriptive link text (e.g., “Read our 2024 Financial Report”), which passes equity to the target page.
- Alt Text: Alternative text allows blind users to understand images. It is also the only way search engines can index the content of an image, driving traffic from Google Images.29
The Evidence:
A landmark study conducted by AccessibilityChecker.org and Semrush analyzed 847 web domains before and after accessibility remediation. The results were statistically significant:
- 73.4% of domains experienced an increase in organic traffic post-remediation.
- The average increase in organic traffic was 12%.
- 66.1% of domains saw an increase of up to 50% in their monthly organic traffic.33
This data confirms that accessibility remediation functions effectively as a high-impact technical SEO audit, clearing technical debt that hinders both users and crawlers.
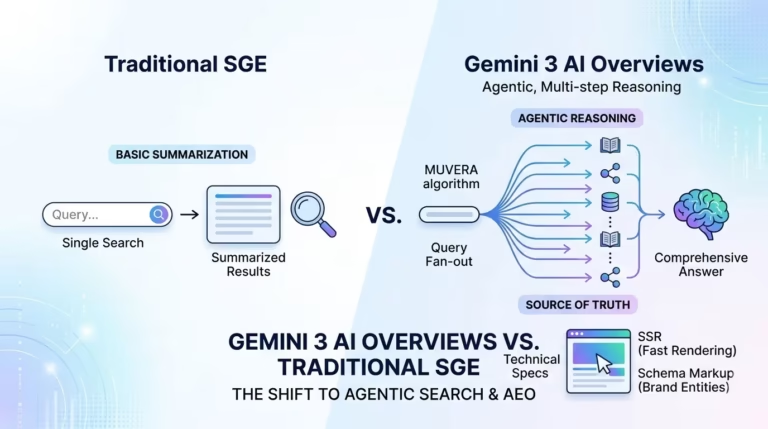
4.2 Generative Engine Optimization (GEO): The Future of Discoverability
As we move into 2025, user search behavior is shifting from traditional query-response models (Google Search) to conversational AI models (ChatGPT, Perplexity, Bing Copilot, Google AI Overviews). This shift requires a new optimization strategy known as Generative Engine Optimization (GEO).
The Accessibility-GEO Nexus:
Large Language Models (LLMs) are trained on vast datasets of text and code. When an AI agent crawls a website to generate an answer, it parses the HTML structure. If a website is inaccessible—characterized by div-soup (generic code), poor labeling, or lack of semantic hierarchy—the AI struggles to parse, categorize, and retrieve the information.
- Machine Readability: Accessibility standards ensure that content is “machine-readable.” A site that parses well for a screen reader parses well for an LLM. This increases the probability of your content being retrieved and cited as a source in an AI-generated answer.34
- Multimodal Future: As AI search becomes multimodal (searching via voice or image), accessible metadata becomes even more critical. Transcripts for videos and alt text for images provide the textual layer that LLMs need to index non-text media.35
- Authority Signals: AI models prioritize “high-quality” sources. Technical accessibility is a strong signal of site quality and authority, which correlates with higher citation rates in Generative AI outputs.35
Strategic Implication: Investing in WCAG compliance today is effectively a future-proofing strategy for the AI era. Companies that ignore accessibility risk becoming “invisible” to the AI agents that will increasingly mediate consumer purchasing decisions.
Table 3: The Intersection of WCAG, SEO, and GEO
| Technical Requirement (WCAG) | Benefit for Disabled Users | Benefit for Traditional SEO (Google) | Benefit for GEO (AI/LLMs) |
| Semantic HTML (H1-H6) | Enables navigation by structure. | Clarifies content hierarchy/keywords. | Helps LLMs parse & summarize facts. |
| Alt Text for Images | Describes visual content. | Indexes images for image search. | Allows multimodal AI to “see” content. |
| Video Transcripts | Access for deaf/hard of hearing. | Increases keyword density. | Provides training/retrieval text for AI. |
| Descriptive Links | Provides context for navigation. | Passes anchor text value. | Clarifies relationships between entities. |
| Clean Code/Speed | usability for motor/cognitive needs. | Core Web Vitals ranking factor. | Reduces token usage/processing cost. |
5. Comprehensive Client Case Studies: Real-World ROI
The theoretical benefits of accessibility are validated by the documented financial successes of major corporations that have integrated inclusive design into their business models.
5.1 Retail: Tesco (UK)
The Challenge:
In the early 2000s, Tesco, one of the world’s largest grocery retailers, identified that its online home shopping service was largely inaccessible to blind and visually impaired customers. The site relied on complex layouts and heavy imagery that confused screen reading software.
The Solution:
Tesco partnered with the Royal National Institute of Blind People (RNIB) to develop a separate, highly accessible interface known as “Access for Everyone.” This interface prioritized semantic HTML, descriptive links, and a simplified visual layout.
The Financial Outcome:
- Revenue Growth: The accessible platform generated £13 million in annual revenue, a figure that far exceeded expectations.29
- Return on Investment: With a development cost of approximately £35,000, the ROI was staggering, turning a modest IT project into a major revenue stream.8
- Universal Appeal: Unexpectedly, the “accessible” site became popular with non-disabled users. Sighted customers with slower internet connections or older computers preferred the accessible version because it loaded faster and was easier to navigate. This led to an increase in pre-Christmas orders to 700,000 per week.29
- Strategic Evolution: Realizing the value of the accessible design, Tesco eventually merged the two sites, applying the accessibility principles to their main e-commerce platform to benefit all users.
5.2 Financial Services: Barclays (Global)
The Challenge:
Barclays Bank faced a dual challenge: a reputational need to serve all customers inclusive of the elderly and disabled, and an operational need to update their mobile banking infrastructure. An initial assessment to fix accessibility issues in their existing app returned a prohibitive cost estimate.
The Solution:
Barclays utilized the “Shift Left” strategy. Instead of patching the old app, they redesigned it with accessibility as a core requirement from day one. They involved diverse user groups in the design process to catch barriers early.
The Financial Outcome:
- Cost Efficiency: The cost to build the app accessibly from the start was £30,000, compared to the £300,000 estimate for retrofitting the old app. This represents a 90% saving in development costs.27
- Customer Satisfaction: The improved usability of the app led to a dramatic increase in customer satisfaction scores. The app’s rating on the App Store jumped from 2 stars to 4.5 stars, driven by the improved UX that accessibility features (like clearer fonts and better contrast) provided to all users.27
- Brand Leadership: Barclays established itself as a leader in “inclusive banking,” creating a competitive differentiator in the crowded fintech market.
5.3 Insurance: Legal & General (UK)
The Challenge:
Legal & General, a major financial services provider, suffered from high dropout rates in their online insurance quote generation process. The site was difficult to navigate and contained accessibility barriers.
The Solution:
The company undertook a comprehensive digital revamp focused on accessibility. They optimized form fields, improved color contrast, and streamlined the navigation flow to meet WCAG standards.
The Financial Outcome:
- Conversion Rate: The changes resulted in a 100% increase in conversion rates for online quotes. By removing friction for disabled users, they removed friction for everyone.8
- Maintenance Savings: The cleaner, more standardized code base resulted in a 40% reduction in ongoing web maintenance costs, proving that accessible code is also efficient code.8
- Traffic Growth: The site saw a 50% increase in organic search traffic within months of the relaunch, validating the SEO benefits of accessibility.
5.4 Public Sector: Government Digital Service (UK) & California.gov (USA)
The Challenge:
Governments have a mandate to serve 100% of the population. Inefficient websites force citizens to use expensive channels like call centers.
The Solution:
Both the UK’s GDS and the State of California (in its 2024 redesign) adopted a “Digital First” and “Accessibility First” strategy. This involved simplifying language, making sites mobile-responsive, and ensuring screen reader compatibility.
The Financial Outcome:
- USA Savings: The U.S. Department of Justice estimates that the new digital accessibility rules for state and local governments will generate $192.6 million per year in savings. This is derived from citizens shifting from analog channels (phone/in-person) to digital self-service.30
- UK Efficiency: The UK GDS redesign saw daily users rise from 15,000 to 26,000 while reducing the average time spent on a page. This counter-intuitive metric (less time on site) indicated success: citizens were finding the information they needed faster and leaving satisfied, rather than getting lost. They also reduced the number of PDF documents from 12,000 to a few hundred, saving massive amounts on document maintenance and storage.29
5.5 Investment Banking: Merrill Lynch (Bank of America)
The Challenge:
Merrill Lynch needed to ensure its workforce and high-net-worth clients could access complex financial data and training materials on mobile devices. The complexity of financial charts posed a significant barrier to accessibility.
The Solution:
They developed a mobile platform specifically designed with accessibility principles—scalable text, linear data presentation, and high contrast.
The Financial Outcome:
- Engagement: The accessible mobile benefits site saw a 46% jump in visits, driven by the ease of use.38
- Productivity: The accessible training modules allowed 60,000 employees to complete mandatory training during downtime on their mobile devices (BlackBerrys at the time), significantly boosting workforce productivity and compliance rates.39
6. E-Commerce Specifics: The Cost of Abandoned Carts
The retail sector presents the most direct correlation between accessibility and revenue. In the high-volume, low-margin world of e-commerce, friction is the enemy of profit.
6.1 The Economics of Cart Abandonment
For users with disabilities, the checkout process is often the most formidable barrier. Inaccessible form fields (which don’t tell a screen reader what to type), poor keyboard navigation (preventing a user from hitting the “Buy” button), and time-limited sessions are common reasons for cart abandonment.
- Revenue Leakage: As noted, U.S. e-commerce retailers lose approximately $6.9 billion annually to inaccessible design.7
- Holiday Impact: During the holiday shopping season alone, it is estimated that e-commerce platforms lose $828 million due to accessibility failures.8
- The “Compare and Switch” Behavior: Disabled users are highly comparative shoppers. The Click-Away Pound report highlights that these users will quickly identify which sites work for them and switch their loyalty permanently. Once a disabled user finds an accessible grocer or clothing retailer, the Lifetime Value (LTV) of that customer is exceptionally high because the cost of switching (finding another accessible site) is high.
6.2 Case Study: Retail Industry Litigation Trends
The retail sector faces the highest volume of ADA lawsuits, accounting for over 30% of all filings in early 2025.22 The focus is heavily on “Consumer Durables & Apparel” and “Food & Beverage.”
- Target Corporation: Following a landmark lawsuit in the mid-2000s (National Federation of the Blind v. Target Corp), Target settled for $6 million but then invested heavily in accessibility. Today, Target is widely recognized as a leader in digital inclusion, and their accessible site is cited as a key factor in their robust e-commerce growth.
- Domino’s Pizza: Domino’s fought a Supreme Court battle over website accessibility and lost. The negative PR and legal costs far outweighed the cost of fixing the app, which serves as a cautionary tale for the industry.15
7. Implementation Roadmap: From Compliance to Competitive Advantage
To realize these financial benefits, organizations must transition from a reactive “fix-it” mentality to a proactive “build-it-right” strategy.
7.1 Phase 1: Assessment and Strategy
- Audit vs. Overlay: Do not rely on automated scans alone, which only catch ~30% of errors. Commission a manual audit including testing by native screen reader users. Avoid overlays entirely; they are a sunk cost that provides no legal cover.23
- Business Case Development: Use the data from this report to build a business case based on ROI (SEO, Market Reach) rather than just risk.
7.2 Phase 2: The “Shift Left” Integration
- Design System: Integrate accessibility into the corporate Design System. If the buttons and form fields in the component library are accessible, 80% of the work is done for every future project.
- Procurement: Mandate accessibility in procurement contracts. Demand a Voluntary Product Accessibility Template (VPAT) from all software vendors. If a vendor’s tool breaks your site’s compliance, it is your liability.
7.3 Phase 3: Culture and Training
- Champions Network: Emulate Sainsbury’s model by appointing “Accessibility Champions” in every department (Engineering, Design, Content, Marketing).
- Continuous Monitoring: Accessibility is not a project; it is a process. Implement automated monitoring in the CI/CD pipeline to prevent regression (i.e., stopping developers from accidentally breaking accessibility with new code).
Table 4: Cost Comparison of Implementation Approaches
| Approach | Initial Cost | Ongoing Cost | Risk Reduction | ROI Potential |
| Ignore | $0 | High (Lawsuits/Lost Sales) | None | Negative |
| Overlay/Widget | Low ($500-$2k/yr) | Perpetual Subscription | Low/Negative (Target for lawsuits) | Negative |
| Retrofit (Fix Later) | High ($10k-$50k+) | High (Maintenance) | Medium | Moderate |
| Shift Left (Build Right) | Moderate (Training) | Low (Integrated) | High | Maximum |
8. Future Outlook: 2025 and Beyond
The trajectory for digital accessibility points toward it becoming a standard non-negotiable requirement for doing business, driven by three converging forces:
- Regulatory Harmonization: The European Accessibility Act (2025) will effectively set the global standard. Companies cannot afford to maintain separate codebases for the EU and the rest of the world. WCAG 2.1/2.2 AA will become the de facto global baseline.
- The AI Intermediary: As consumers increasingly use AI agents to shop and search, the “readability” of a website by a machine will define its commercial success. Accessibility is the syntax of this readability.
- The Aging Wealth: As the wealthiest generation in history (Baby Boomers) ages into disability, the “Purple Pound” will grow. Businesses that are not accessible will essentially be locking their doors to their richest customers.
9. Frequently Asked Questions (FAQ)
Q1: Is WCAG compliance legally required for private businesses?
A: Yes, in many jurisdictions. In the United States, courts specifically in the 2nd, 9th, and 11th Circuits have consistently interpreted Title III of the ADA to apply to websites as “places of public accommodation.” In the European Union, the European Accessibility Act (EAA) explicitly mandates compliance for private companies in e-commerce, banking, and transport services starting June 2025.20
Q2: How much does it cost to make a website accessible?
A: Costs vary significantly based on the approach. Retrofitting an existing small-to-medium website typically costs between $3,000 and $10,000. Large enterprise remediations can exceed $50,000. However, incorporating accessibility into a new build from the start (Shift Left) typically adds only 1-5% to the total project budget while preventing costly future rework.21
Q3: Can’t I just use a “quick fix” accessibility widget or overlay?
A: No. Overlays do not achieve WCAG compliance at the code level and are increasingly rejected by the legal community. In 2024, nearly 23% of accessibility lawsuits targeted sites using these widgets. They offer little to no legal protection and can interfere with the assistive technology used by people with disabilities.22
Q4: How quickly will I see a Return on Investment (ROI)?
A: ROI timelines vary by metric. Risk mitigation ROI is immediate (avoidance of lawsuits). SEO and traffic improvements typically manifest within 6 to 12 months as search engines re-index the cleaner code. Revenue gains from the “Purple Pound” accrue as the brand builds a reputation for inclusivity.41
Q5: Does accessibility really help with SEO and AI Search?
A: Yes. There is a strong technical correlation. Accessible sites utilize semantic HTML, alt text, and clear structures—the exact signals Google uses to rank pages and that AI models (LLMs) use to understand and cite content. Studies show an average 12% increase in organic traffic following accessibility remediation.33
Conclusion
The data synthesized in this report leads to an incontrovertible conclusion: WCAG compliance is a profit center, not a cost center.
The financial narrative of accessibility has matured. While risk mitigation remains a valid driver—avoiding the $50,000 cost of a lawsuit is prudent—it is the upside potential that demands executive attention. Accessibility opens the door to a $13 trillion global market, improves conversion rates by 100% (as demonstrated by Legal & General), reduces development costs by 90% (as shown by Barclays), and optimizes digital assets for the coming age of AI-driven discovery.
For business leaders in 2024 and 2025, the strategic choice is binary: invest in accessibility now to build a robust, inclusive, and high-performing digital ecosystem, or pay a significantly higher premium later in lost revenue, legal settlements, and technical debt. In the modern economy, inclusion is the ultimate competitive advantage.
Reference/Works cited
- Level Access: First Digital-Accessibility-Only Company to Surpass $100 Million Annual Recurring Revenue (ARR), accessed on December 22, 2025
- What is the Purple Pound? – Charity Digital, accessed on December 22, 2025
- Global Partner | Purple – Hidden Disabilities Sunflower, accessed on December 22, 2025
- Digital accessibility and the cost of exclusion – Deque Systems, accessed on December 22, 2025
- Website accessibility’s impact on conversion rates – PayPal, accessed on December 22, 2025
- The Click-Away Pound Survey 2019 – Home Page, accessed on December 22, 2025
- The Cost of Inaccessibility: Businesses Lose More Than $6.9 Billion Annually, accessed on December 22, 2025
- Unlocking Revenue Through Web Accessibility – e-commerce WCAG compliance, accessed on December 22, 2025
- Web Accessibility & SEO in 2024: Essential for Online Success – Lotus Optimisation, accessed on December 22, 2025
- Why should businesses design goods for better accessibility to people with disabilities?, accessed on December 22, 2025
- A Case Study on Sainsbury’s D&I Strategy and Its Impact – Diverse Workforce, accessed on December 22, 2025
- ADA Web Accessibility Lawsuit Trends & Statistic: 2024 in Review – Accessibility.Works, accessed on December 22, 2025
- A Rise in ADA Website Accessibility Lawsuits May Leave You Asking: Is My Website A Risk?, accessed on December 22, 2025
- Website Accessibility in 2025: Lessons from 2024 Lawsuit Trends – AudioEye, accessed on December 22, 2025
- Web Accessibility for SEO Growth | Global Reach Bi-Weekly Blog, accessed on December 22, 2025
- Civil Penalties for Accessibility Violations | WSC – Web Standards Commission, accessed on December 22, 2025
- ADA Website Lawsuits | Accessible.org, accessed on December 22, 2025
- ADA Website Compliance Lawsuit Settlement Amounts | Accessible.org, accessed on December 22, 2025
- $25000? Website Accessibility Lawsuits Cost Money, accessed on December 22, 2025
- ADA Compliance Fines: What They Cost & Who’s at Risk – AudioEye, accessed on December 22, 2025
- Website Accessibility vs. Lawsuit Costs: Save Money Early – AudioEye, accessed on December 22, 2025
- The Rising Tide of ADA Website Accessibility Litigation: 2025 Insights | DarrowEverett LLP, accessed on December 22, 2025
- 2025 Midyear Accessibility Lawsuit Report: Key Legal Trends – UsableNet Blog, accessed on December 22, 2025
- Penalties for non-compliance with the European Accessibility Act (EAA) – Silktide, accessed on December 22, 2025
- European Accessibility Act (EAA) Fines, accessed on December 22, 2025
- European Accessibility Act Fines: Avoid EAA lawsuits – Recite Me, accessed on December 22, 2025
- Accessibility guide for Suppliers – Barclays, accessed on December 22, 2025
- New UK survey urges retailers to prioritize accessibility to prevent losing billions, accessed on December 22, 2025
- 6 companies that boosted business with accessibility, accessed on December 22, 2025
- Long-Term Benefits of Digital Accessibility for Local Government, accessed on December 22, 2025
- The Business Case for Digital Accessibility | Key Points, accessed on December 22, 2025
- SEO & Accessibility in 2024 Key Strategies for Success – UserWay, accessed on December 22, 2025
- Does web accessibility have a positive impact on SEO?, accessed on December 22, 2025
- Generative Engine Optimization (GEO): How to Win in AI Search – Backlinko, accessed on December 22, 2025
- How Accessibility Affects Generative Engine Optimization (GEO) And Search Results, accessed on December 22, 2025
- Future-Proof Your Brand with GEO & Accessibility – Level Access, accessed on December 22, 2025
- Tesco – Case Study of Accessibility Benefits | Web Accessibility Initiative (WAI) – W3C, accessed on December 22, 2025
- Merrill Lynch’s mobile benefits site sees 46pc jump in visits | Retail …, accessed on December 22, 2025
- Merrill Lynch: Bullish on Mobile Learning – Chief Talent Officer, accessed on December 22, 2025
- How Much Does It Cost to Make a Website Accessible? – Atyantik Technologies, accessed on December 22, 2025
- The compounding value of investing in digital accessibility and usability | Fable, accessed on December 22, 2025